
National Taxpayer Advocate
2007
ef f e C t o f tA x in C R e A s e A n d
pR e v e n t i o n Re C o n C i l i A t i o n
AC t o f 2005 o n iRs of f e R
i n Co m p R o m i s e pR o g R A m

Effect of Tax Increase and Prevention Reconciliation Act of 2005 on IRS Offer in Compromise Program
Section Three — Effect of Tax Increase and Prevention Reconciliation Act of 2005 on IRS Offer in Compromise Program
TIPRA and OIC
Table of
Contents
Effect of Tax Increase and Prevention Reconciliation Act of 2005
On IRS Offer in Compromise Program
Executive Summary
The Tax Increase and Prevention Reconciliation Act (TIPRA) of 2005 was enacted on May
17, 2006. This act included a provision which required that taxpayers seeking to compro-
mise their tax liabilities include a nonrefundable 20 percent payment along with lump-sum
offers. The National Taxpayer Advocate believed that this legislation would have a “chill-
ing” effect on taxpayers wishing to submit such offers. To test this hypothesis, she request-
ed a study to estimate the effects of TIPRA on the IRS offer in compromise program.
TIPRA allows the IRS to waive the partial payment requirement for low income taxpayers.
The initial income threshold used by the IRS to identify low income taxpayers included
taxpayers living at or below the federal poverty level. Prior to the implementation of
TIPRA, the IRS used this threshold to determine taxpayer eligibility for a waiver of the user
fee required for the submission of an offer in compromise (OIC). The IRS has recently
redefined low income taxpayers for this purpose as those whose income is at or below 250
percent of the federal poverty level.
This Taxpayer Advocate Service study was conducted using data obtained from a sample of
closed, accepted offers from the two IRS campuses responsible for processing these cases.
1
Data from these sample cases were collected and tabulated to provide information on the
source of offer funds, the availability of the 20 percent TIPRA payment, and the size of the
offer, in addition to a variety of data on taxpayers’ income and assets. In addition to provid-
ing basic data on all sampled taxpayers, this report focuses on stratifying the data by two
groups of taxpayers: those taxpayers with income above the poverty level but not exceed-
ing 250 percent of the poverty level, and those taxpayers with income above 250 percent
of the poverty level. More in-depth data was not provided on the group of taxpayers with
incomes below the federal poverty level because this group was automatically eligible for
the waiver of the 20 percent payment.
The most significant conclusions from this study appear below:
Taxpayers with incomes above the poverty level or even with incomes above 250
percent of the poverty level are not significantly more likely to be able to afford the 20
percent TIPRA payment than those taxpayers with incomes at, or below, the poverty
level.
1
TAS sincerely appreciates the cooperation of the Small Business/Self Employed (SB/SE) Operating Division, which provided TAS access to these closed,
accepted offer in compromise cases at the Memphis and Brookhaven campuses.
2

Table of
Contents
Effect of Tax Increase and Prevention Reconciliation Act of 2005 on IRS Offer in Compromise Program
TIPRA and OIC
TIPRA and OIC
The most common source of offer funds is family and friends. It is unlikely that these
third parties will provide funds for an offer since they are likely to forfeit 20 percent of
the offered amount without compromising the liability for the taxpayer.
Only half of the sample taxpayers below the poverty level are currently receiving waiv-
ers of the offer in compromise submission user fee. This finding suggests that some
taxpayers eligible for a waiver of the 20 percent TIPRA payment will not be afforded
this opportunity.
2
Additionally, IRS offer receipts have, in fact, declined by about 21 percent from fiscal year
(FY) 2006 to FY 2007. This decrease suggests that TIPRA may indeed have a “chilling”
effect on the number of offer submissions. To address these issues, the National Taxpayer
Advocate included the repeal of the 20 percent TIPRA payment as a legislative recommen-
dation in her 2006 Annual Report to Congress.
Background
Section 7122 of the Internal Revenue Code (IRC) authorizes the IRS to compromise tax
liabilities. The most common reason that the IRS compromises tax liabilities is because
of doubt that the taxpayer has sufficient assets or income to satisfy the tax liability during
the collection statute. Although by accepting an offer in compromise, the IRS is conceding
the collection of the full amount of tax, penalties, and interest, studies have shown that
the acceptance of offers is actually beneficial to the IRS as well as to the taxpayer. An IRS
study of offers submitted from 1998 through 2003 showed that in 44 percent of the offers
rejected by the IRS, only half of the amounts offered by taxpayers had been collected.
3
Doubt as to collectibility offers may be submitted with a deposit of money to express the
taxpayer’s good faith in submitting the offer, although prior to the enactment of the TIPRA
legislation this practice was not encouraged because of the administrative burden on the
IRS. Prior to the implementation of TIPRA, any deposit was held by the IRS pending its
decision to accept or reject the offer. In the event of the offer’s rejection by the IRS, the
offer deposit was returned to the taxpayer. Under the new law imposed by TIPRA, a lump-
sum offer, one made in five or fewer installments, must include a payment of 20 percent of
the amount offered. Other offers, called “periodic payment” offers, must be accompanied
by a payment of the first proposed installment amount and these payments must continue
2
Alternatively, some taxpayers may not obtain a waiver as a result of “procedural” or “lazy” noncompliance in which either administrative complexity is a
hurdle or taxpayers are unwilling or unable to satisfy the requirements. For more information about types of noncompliance, see Les Book, The Poor and
Tax Compliance: One Size Does Not Fit All, 51 Kan. L. Rev. 1145 (2003), citing, Robert Kidder & Craig McEwen, Taxpaying Behavior in Social Context: A
Tentative Typology of Tax Compliance and Noncompliance, 2 Taxpayer Compliance 57 (1989).
3
IRS Offers in Compromise Program, Analysis of Various Aspects of the OIC Program 11 (Sept. 2004). The study also concluded:
•
The IRS eventually collected less than 80 percent of what individual taxpayers were offering in 54 percent of the OICs that it rejected and in 66 percent
of the OICs that it returned after acceptance for processing.
•
The IRS collected nothing from individual taxpayers in 21 percent of the OICs that it rejected and in 37 percent of the OICs that it returned after accep-
tance for processing. The IRS collected nothing from business taxpayers in 46 percent of the OICs that it rejected and in 60 percent of the OICs that it
returned after acceptance for processing.
3

Effect of Tax Increase and Prevention Reconciliation Act of 2005 on IRS Offer in Compromise Program
Section Three — Effect of Tax Increase and Prevention Reconciliation Act of 2005 on IRS Offer in Compromise Program
TIPRA and OIC
Table of
Contents
until the IRS determines if the offer is acceptable or until the offer is withdrawn by the
taxpayer. Under the law imposed by TIPRA, neither the 20 percent payment nor the
periodic payments are refundable to the taxpayer. Of course, if the IRS accepts the offer,
these amounts are deemed to be part of the offered amount; however, if the IRS rejects
or returns the offer, the amounts are applied to the underlying liability, with the remain-
ing amount still due from the taxpayer.
4
This is a difficult and precarious position for the
taxpayer, as the funds offered may be borrowed and will have to be repaid in addition to
the uncompromised liability, or the funds may be a gift given for the purpose of the offer,
but now forfeited under the TIPRA rules without accomplishing the intent of the party
providing the funds. The fact that the IRS accepts less than one-quarter of all offers makes
this collection alternative especially risky for taxpayers.
Both TIPRA and user fee regulations permit the IRS to exempt low income taxpayers from
the user fee and 20 percent payment requirements. The IRS initially defined low income
taxpayers as those with income at or below the federal poverty level. However, the IRS has
recently redefined low income as those taxpayers with income at or below 250 percent of
the federal poverty levels.
4
For offers deemed non-processable by the IRS, the user fee is returned to the taxpayer, but the partial payment is applied to the taxpayer’s liability.
4

Table of
Contents
Effect of Tax Increase and Prevention Reconciliation Act of 2005 on IRS Offer in Compromise Program
TIPRA and OIC
TIPRA and OIC
Introduction
The National Taxpayer Advocate requested a study to estimate the impact of TIPRA legisla-
tion on the ability of taxpayers to receive consideration of acceptable offers to compromise
tax liabilities. The study was designed to examine the likely effects of TIPRA legislation on
the IRS offer in compromise program. Specifically, the study explored a sample of closed
offers that the IRS had accepted to determine the offer type and amount and to compare
this information to taxpayer income, assets, and tax liability characteristics. Of most impor-
tance was the determination of whether the taxpayer had the ability to make the 20 percent
partial payment and the source of funds for the offer, as these factors are most pertinent
to the effect of TIPRA on taxpayers’ ability to submit viable offers to compromise their tax
liabilities.
This study was conducted in cooperation with the IRS’s Small Business/Self-Employed (SB/
SE) Operating Division. SB/SE personnel allowed TAS employees to review a sample of
closed, accepted offers in both the Brookhaven and Memphis campuses, providing over 400
such offers for review.
In light of the waiver available for low income taxpayers to be exempted from the TIPRA
user fee, the study results have also been stratified by whether the taxpayer submitting the
offer had income at or below the poverty level, at or below 250 percent of the poverty level,
or above the 250 percent of poverty level threshold. Some of the results of this study have
already appeared in the National Taxpayer Advocate’s 2006 Annual Report to Congress.
5
However, this report contains a more comprehensive summary of all findings from the
study.
Methodology
SB/SE agreed to make a sample of closed, accepted offers available for TAS personnel to
review. Since offer in compromise case closing operations have been consolidated into
the Brookhaven and Memphis campuses, SB/SE provided sample offer cases for review at
each campus. For an attribute sample with a margin of plus or minus five percent at the 95
percent confidence level, an overall sample of about 400 cases was required.
6
The sample
was split between the Brookhaven and the Memphis campuses. It included both field and
centralized offer cases and was extracted from cases that were being prepared for shipment
to the Federal Records Center. Ultimately, the final sample contained 414 cases, 210 from
Brookhaven and 204 from Memphis. A data collection instrument (DCI) was developed to
capture the necessary data. The DCI was developed by examining the goals of the study
and working with a TAS attorney advisor and other TAS employees with significant Collec-
tion and offer in compromise experience. The following items were included on the DCI:
function working offer (field, COIC, Appeals), initial amount offered, final amount offered,
5
National Taxpayer Advocate 2006 Annual Report to Congress 515-516.
6
An attribute sample is designed to provided percentages of counts for sampled items or ”attributes” within the specified margin, but for variable data such
as dollar amounts, the margin may be larger (than the five percent for the attributes) because of the greater variability of such data.
5

Effect of Tax Increase and Prevention Reconciliation Act of 2005 on IRS Offer in Compromise Program
Section Three — Effect of Tax Increase and Prevention Reconciliation Act of 2005 on IRS Offer in Compromise Program
TIPRA and OIC
Table of
Contents
type of entity making offer, type of offer (cash or deferred), source of funding, gross and
net monthly income, future income, net assets, liquid assets, family size, presence of user
fee waiver, evidence of special circumstances, and availability of the 20 percent offer
payment. The DCIs were completed in September 2006, for offers accepted by the IRS in
the months preceding the effective data of the TIPRA changes. The DCIs were completed
by two TAS analysts, one in Brookhaven and one in Memphis. Both the Brookhaven and
Memphis DCIs were intended to be completed on machine scannable forms; however, the
Brookhaven DCIs were never received by the analyst, and this data was collected on an
identical spreadsheet template. The Brookhaven and Memphis data were combined prior
to final analysis. TAS Research assisted in the DCI design and performed all of the subse-
quent statistical analysis.
Limitations
An ideal sample would have been constituted from all offers accepted by the IRS over an
extended period of time (i.e., six months to a year); however, administrative processing of
closed offers made such a sample prohibitive. Closed offer cases are boxed and shipped
to the Federal Records Center as sufficient volumes accumulate. To construct a random
sample from cases closed over an extended period of time would have involved ordering
and finding about 400 different boxes from the FRC. Accordingly, the cases were sampled
from the supply of offers available at each campus prior to their shipment to the FRC. To
our knowledge, no systematic bias occurred in the extraction of the sample cases by SB/SE.
Another limitation of this study is that the TAS review presumed that the offer terms of the
sample cases would be the same type of terms as those offers submitted after the effective
date of the TIPRA legislation. The TAS study only examined the terms of the offer, as ac-
cepted, to determine the ability to make the required 20 percent TIPRA payment. TAS did
not analyze whether the taxpayer could afford the TIPRA payment requirements, had the
offer have been submitted with different terms.
Findings
The significant findings from this study appear in the following section. A complete list of
all findings can be found in Appendices A, B, and C. Specifically, Appendix A contains the
attribute percentages and mean and median confidence intervals for the each of the study
items for the sample as a whole. Appendix B contains the attribute percentages, means,
and confidence intervals for each of the sample strata. Appendix C contains the medians
and confidence intervals for each of the sample strata. As mentioned earlier, in addition
to the presentation of the significant findings for all sample cases, separate breakouts are
also shown for those offers submitted by taxpayers with income between 100 percent and
250 percent of the poverty level and those taxpayers with income above 250 percent of the
poverty level, since these taxpayers would not have been eligible for a low income waiver of
TIPRA’s partial payment requirements.
6
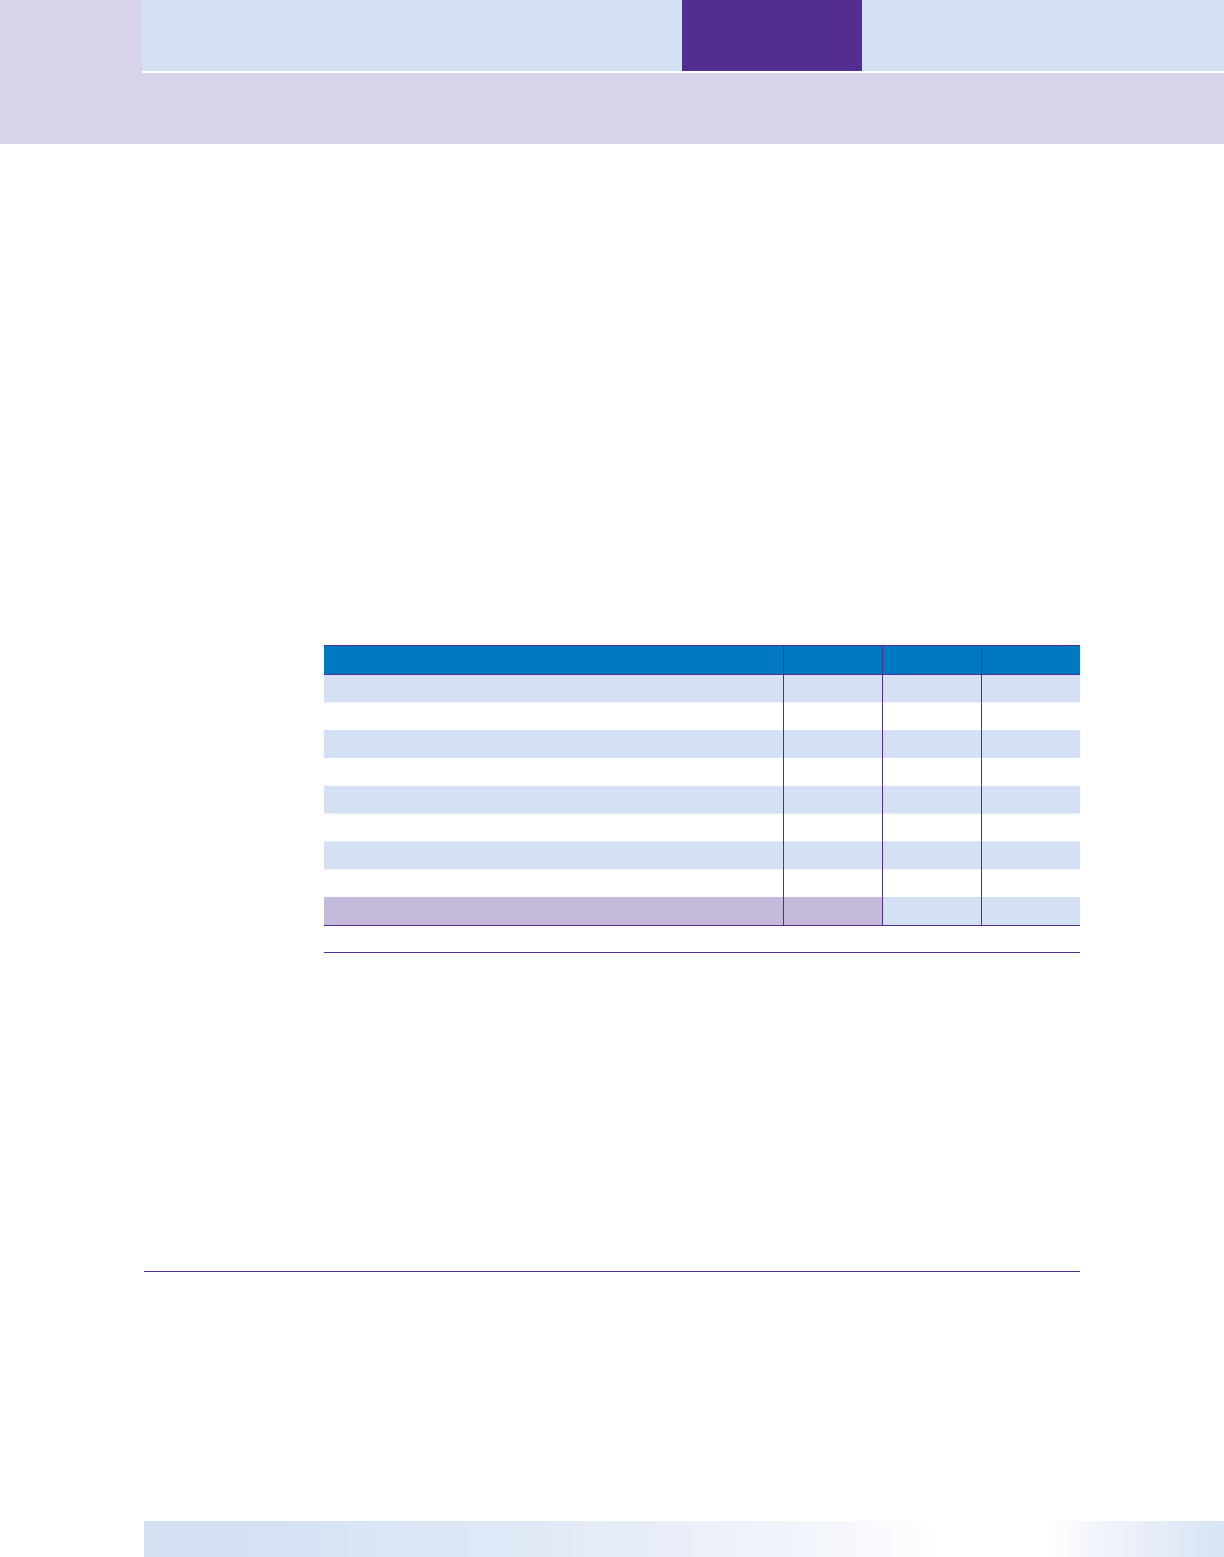
Table of
Contents
Effect of Tax Increase and Prevention Reconciliation Act of 2005 on IRS Offer in Compromise Program
TIPRA and OIC
TIPRA and OIC
When considering the entire sample, over 71 percent of the offers were cash offers, and
would require a 20 percent payment under TIPRA. The median accepted offer amount was
over $5,000, while the average amount was over $13,000. The median net monthly income
was slightly over $650 with the average amount about $1,000 higher. The median future
income was zero, suggesting that requiring many taxpayers to pay with future income may
be unrealistic. Nevertheless, the average amount was over $8,000. Similarly, the median
net assets were only about $2,500, while the average amount was over $10,000. As indicat-
ed in the following table, in over half of the cases reviewed, the source of the offered funds
was the taxpayer’s family or friends, with about 10 percent more of the offers funded from
sources from which the 20 percent TIPRA payment could not be readily obtained.
7
TABLE 2.3.1, Sources Of Offer In Compromise Funds
Category Number Percent Margin (+/-)
Family/Friends 232 56.0% 4.8%
Commercial Loan 24 5.8% 2.3%
IRA/401K 9 2.2% 1.4%
Unsecured Credit 5 1.2% 1.1%
Property Sale 10 2.4% 1.5%
Current Income or Wages 123 29.7% 4.4%
Other 7 1.7% 1.2%
None 18 4.3% 2.0%
Total* 414
*Total Sample Cases. Question allowed multiple responses.
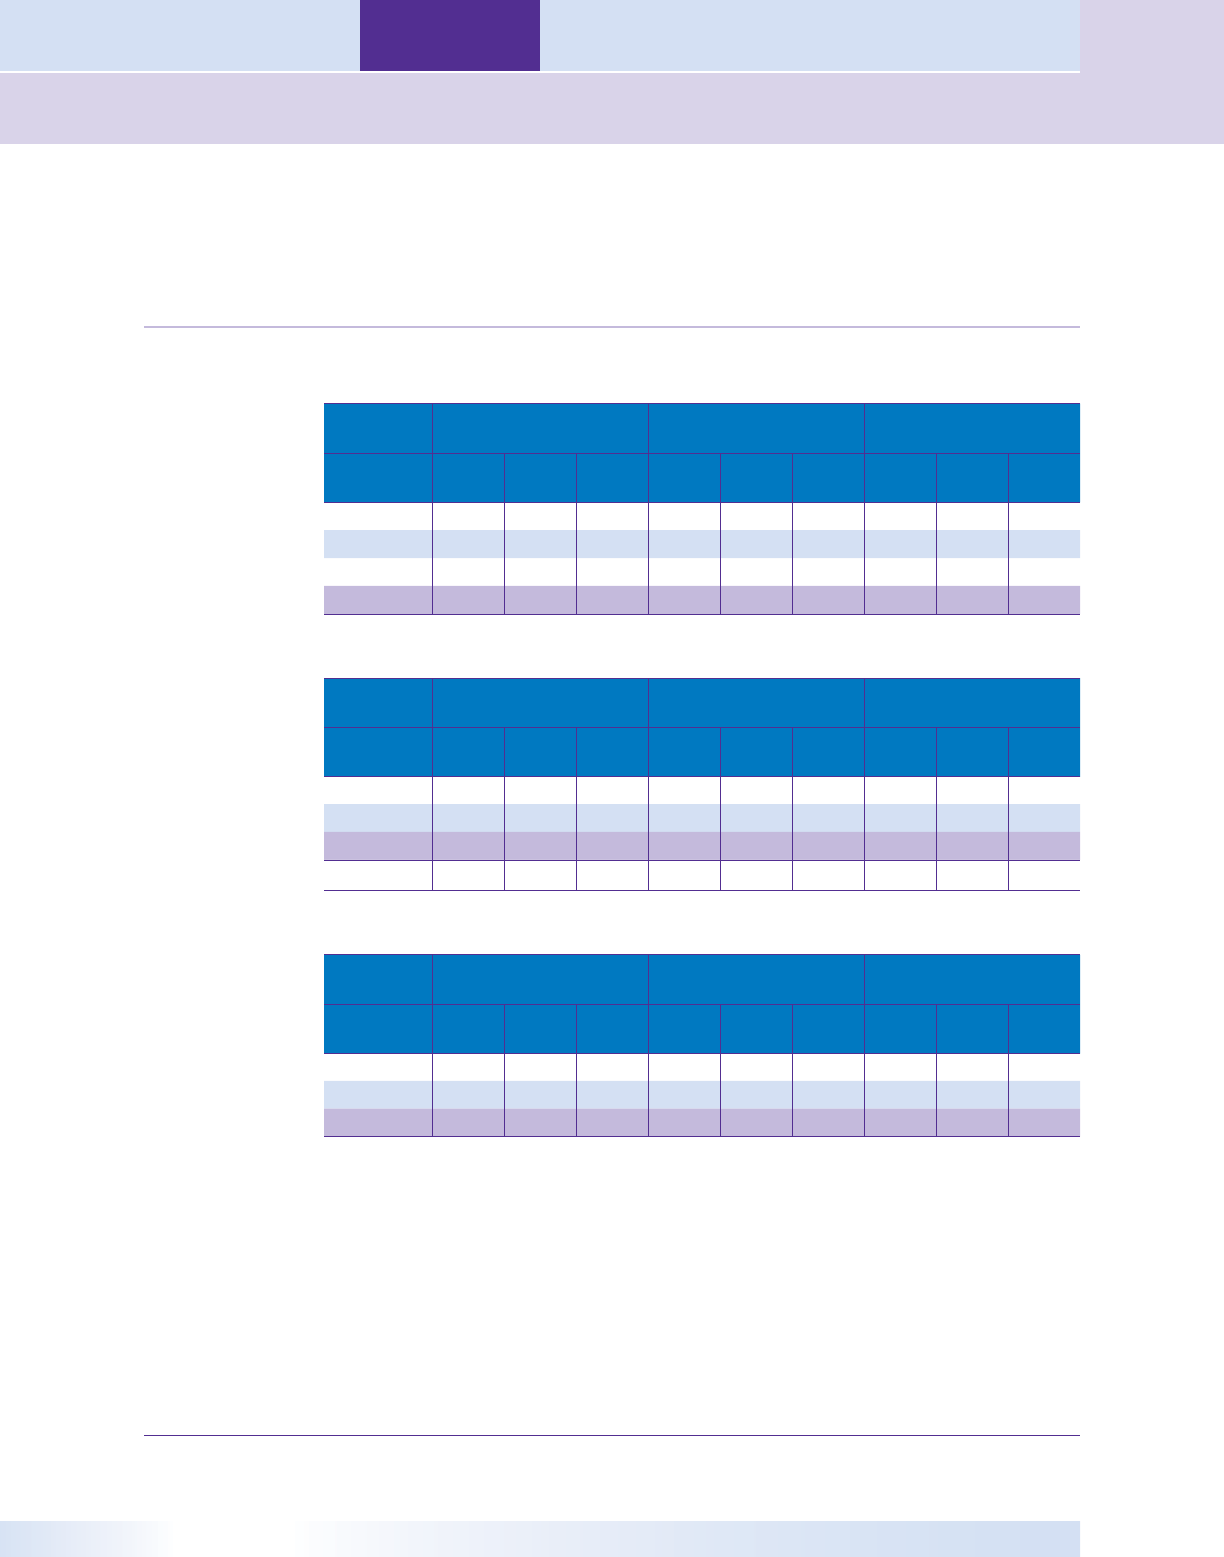
Ultimately, the review of the financial information contained in the case file determined
that in about 70 percent of the offers, the 20 percent TIPRA payment was not available.
8
Moreover, as the following chart illustrates, the inability to provide the 20 percent offer
payment is almost as common in the higher income ranges.
7
Funds from a commercial loan, liquidation of an IRA or other retirement account, and the sale of property are not readily available for a taxpayer’s use and
obtaining funds from these sources may impose significant burden on the taxpayer.
8
For purposes of the study, “liquid assets” included assets that could be liquidated and used for the TIPRA payment (e.g., cash, bank accounts, certificates
of deposit, stock and securities) without incurring significant costs. For example, IRAs were excluded because a ten percent additional tax on early distribu-
tions applies to early withdrawals. The availability of the 20 percent TIPRA payment was based on the source of the offered funds and on whether the tax-
payer’s financial statement showed liquid assets that could be used to make the TIPRA payment. If the taxpayer indicated a personal source for the offer, or
if the provided financial information showed the ability to make the payment, the 20 percent TIPRA payment was considered to be available. Otherwise the
payment was considered to be not available. In the instance of deferred offers, if either the taxpayer’s liquid assets or the analysis of the monthly income
and expenses showed the ability to make the required TIPRA installment payments, the taxpayer was determined to be able to meet the TIPRA payment
requirements.
7
Effect of Tax Increase and Prevention Reconciliation Act of 2005 on IRS Offer in Compromise Program
Section Three — Effect of Tax Increase and Prevention Reconciliation Act of 2005 on IRS Offer in Compromise Program
TIPRA and OIC
Table of
Contents
CHART 2.3.2, Availability of 20 Percent TIPRA Payment
Eighty-eight percent of the sampled cases were from taxpayers with incomes above the
poverty level.
9
Nearly 50 percent of the sample cases were from taxpayers with income
above 250 percent of the federal poverty level, who would not be eligible for a waiver of the
TIPRA 20 percent payment.
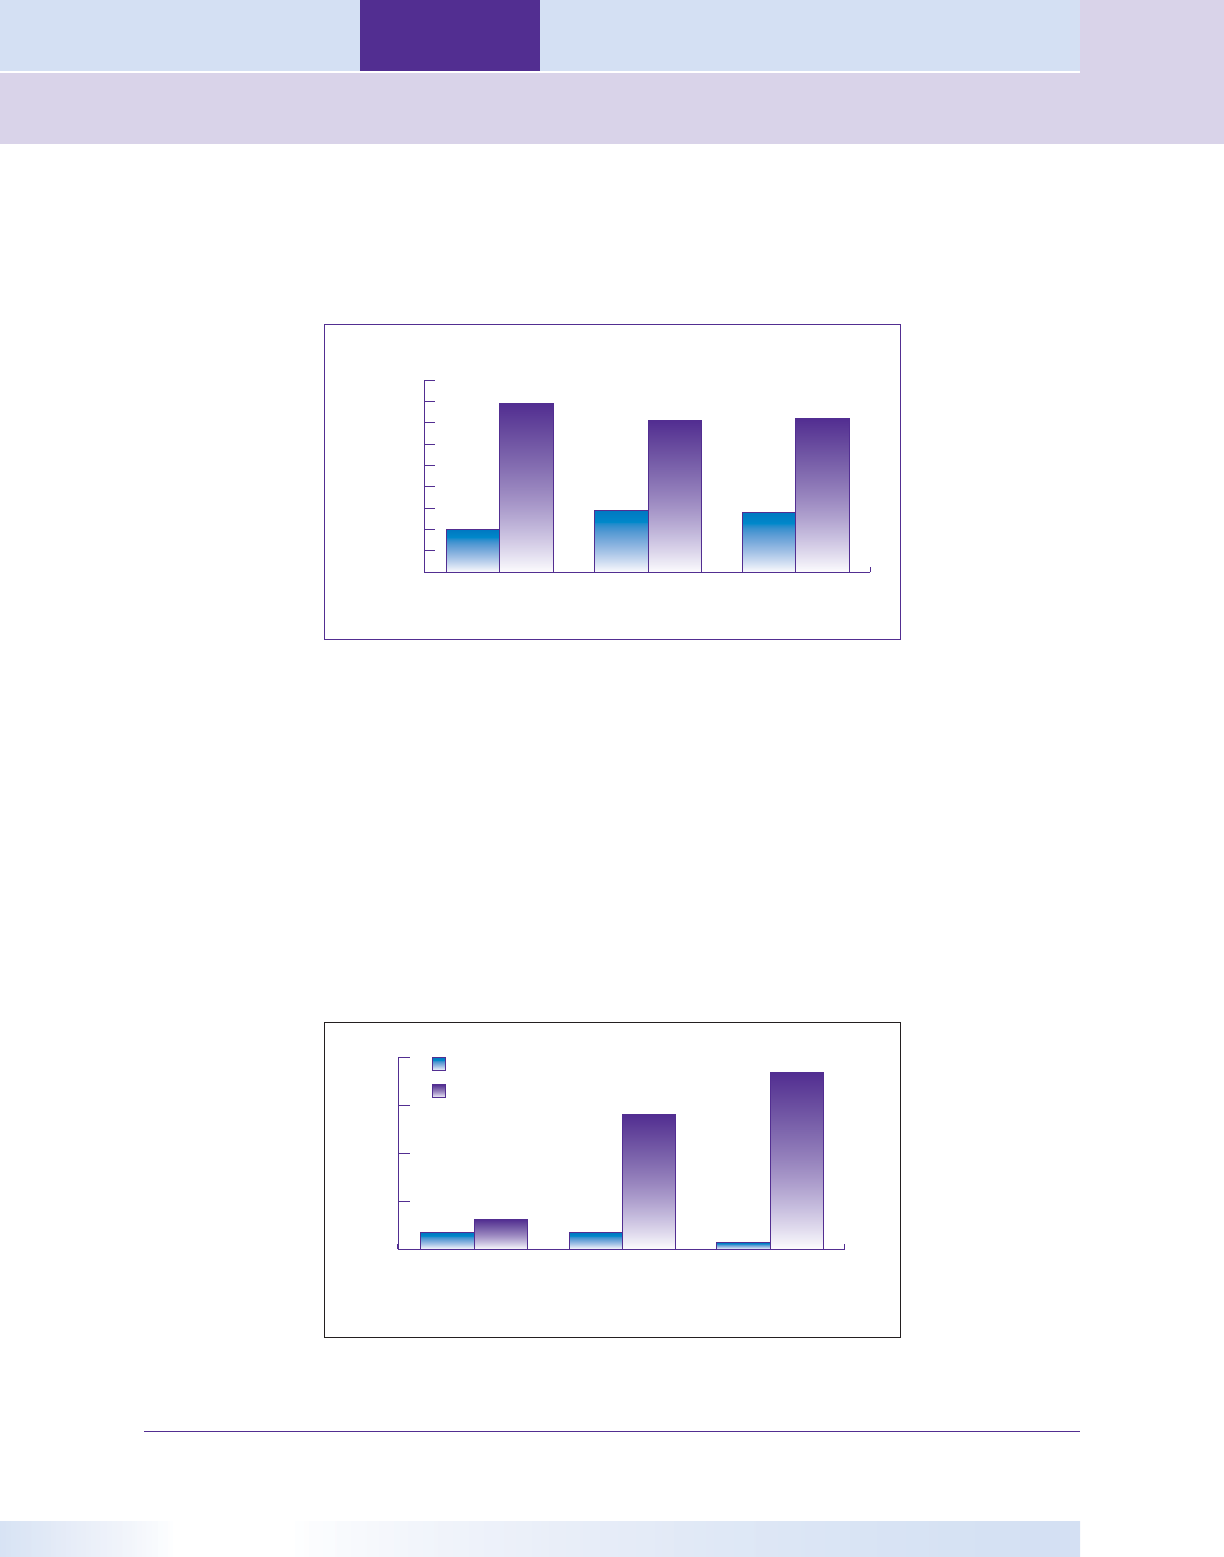
Since taxpayers with incomes at or below the poverty level are exempt from the 20 percent
payment requirement, these sample cases will not be discussed in further detail. However,
as shown in the following chart, it is interesting to note that the fee waiver for the user fee
was present in less than half of these cases.
10
The likelihood of the user fee being waived
decreased progressively as the income strata rose.
CHART 2.3.3, OIC Fee Waivers
9
Poverty level was determined from the 2006 Federal Health and Human Services guidelines according to family size.
10
The upper bound of the 95 percent confidence interval for fee waivers present was 48.9 percent.
Percent
At or Below Poverty Level Above Poverty Level,
Below 250% of
Poverty Level
Above 250%
of Poverty Level
Yes
No
Yes
No
Yes
No
0%
10%
20%
30%
40%
50%
60%
70%
80%
90%
At or Below
Poverty Level
Above Poverty
Level,
Below 250%
of Poverty Level
Above 250%
of Poverty Level
17
Yes
No
17
31
184
140
7
No
0
50
100
150
200
8

Table of
Contents
Effect of Tax Increase and Prevention Reconciliation Act of 2005 on IRS Offer in Compromise Program
TIPRA and OIC
TIPRA and OIC
The following sections of this report will discuss the findings for the two groups of taxpay-
ers whose ability to submit offers is most at risk from the new TIPRA legislation: taxpayers
with income above 250 percent of the poverty level and taxpayers with income below 250
percent of poverty level, but above the base poverty level.
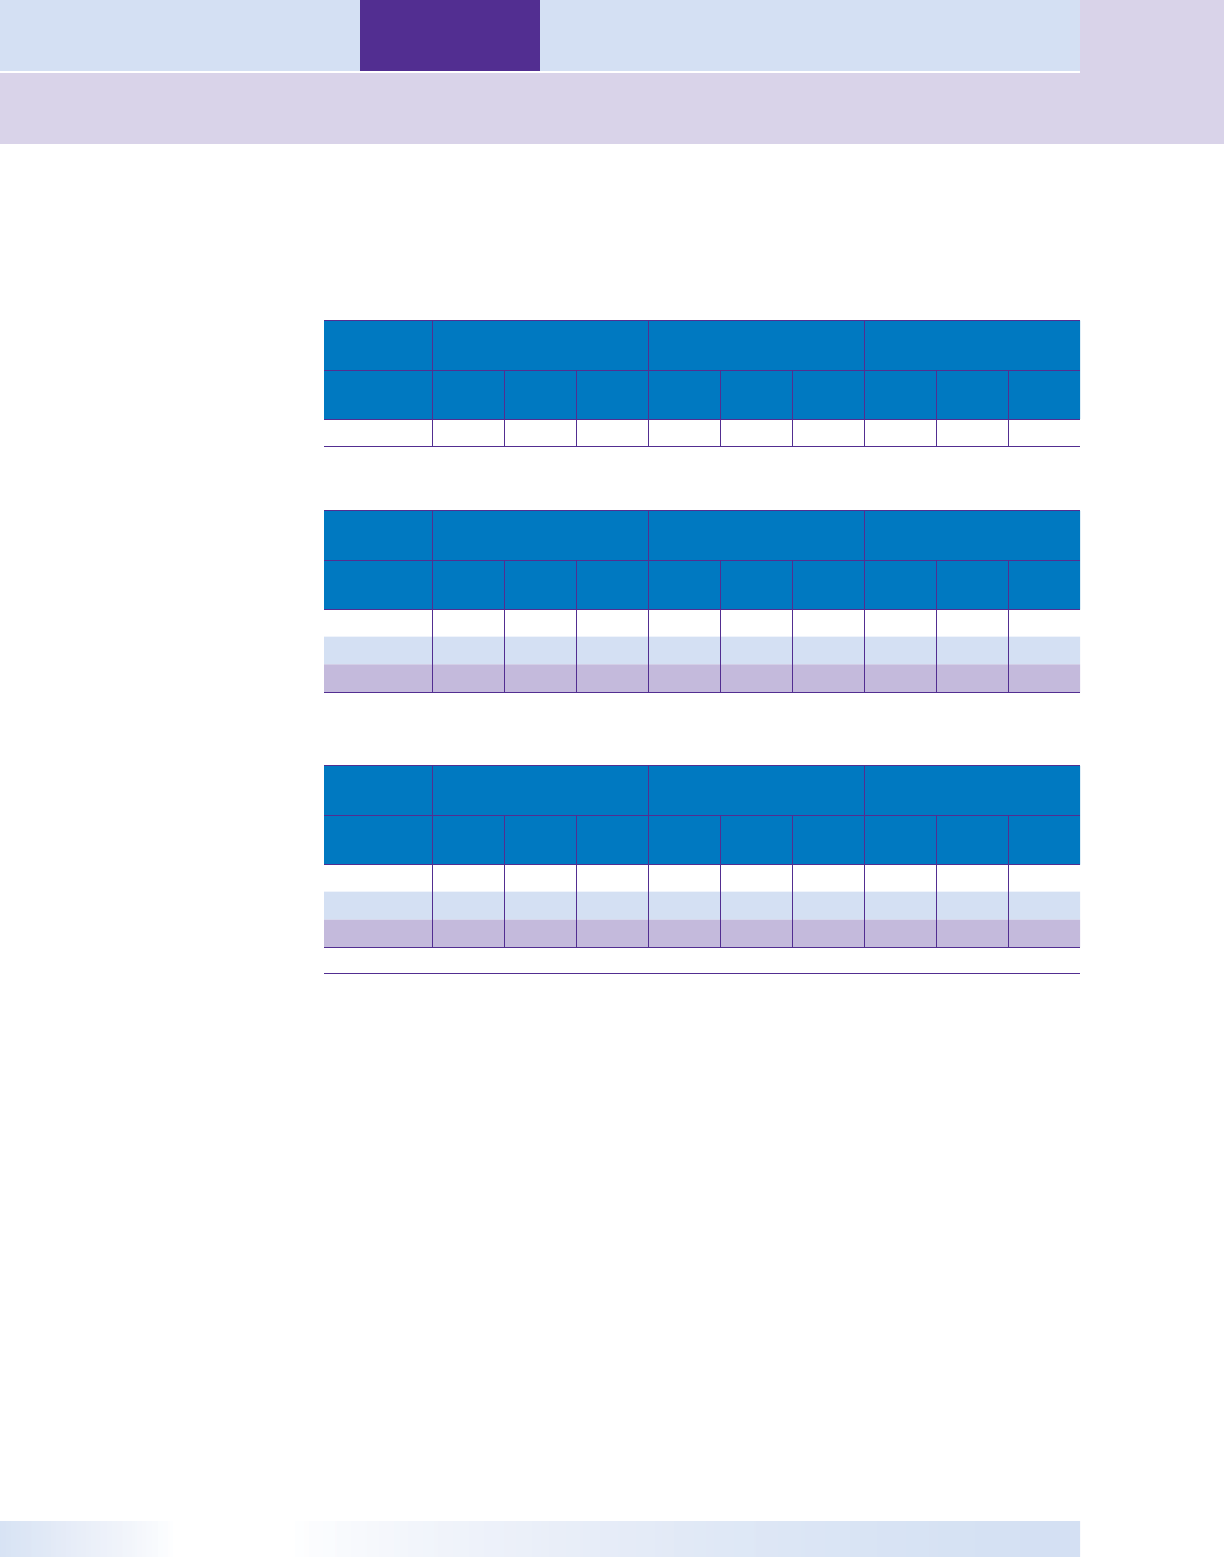
Incomes above 250 percent of Poverty Level
Over 60 percent of this income group submitted cash offers. The median accepted offer
amount for taxpayers with incomes higher than 250 percent of the poverty level was over
$10,000, with the average accepted offer amount at nearly $25,000. These taxpayers had
similar average and median net monthly incomes at $2,490 and $2,269, respectively. The
median future income for this group was $3,264, while the average was over $11,500. The
median net assets were over $4,000, while the average amount was over $19,000. However,
the liquid median assets were less than $150 with the average amount at slightly over
$1,300. As with the sample as a whole, the primary source of funding for this group’s
offers was family and friends. As indicated in the following chart, this source was primary
for nearly half of the offers.
CHART 2.3.4, Sources of Offer Funding
Similar to each of the other income groups, the ability to provide the required 20 percent
TIPRA payment was not present in about 70 percent of the cases.
Incomes Above Poverty Level and Below 250 percent of Poverty Level
Nearly three-fourths of this income group submitted cash offers. The median accepted
offer amount for taxpayers with incomes above poverty level, but below 250 percent of the
poverty level, was about $3,700 with the average accepted offer amount at nearly $6,900.
The median net monthly income for these taxpayers was less than $100, while the aver-
age net monthly income was over $1,000. The median future income for this group was
zero, while the average amount was under $2,000. The median net assets were less than
Unknown
Other
Current Income or Wages
Property Sales
Unsecured Credit
IRA / 401K
Commercial Loan
Family / Friends
Category
0% 10% 20% 30% 40% 50% 60%
9

Effect of Tax Increase and Prevention Reconciliation Act of 2005 on IRS Offer in Compromise Program
Section Three — Effect of Tax Increase and Prevention Reconciliation Act of 2005 on IRS Offer in Compromise Program
TIPRA and OIC
Table of
Contents
$2,000, while the average amount was over $5,500. However, the liquid median assets were
only $100 with the average amount at less than $500. Again, family and friends were the
primary source of funding for this group’s offers. As the chart below indicates, this source
was cited for almost 60 percent of the offers.
CHART 2.3.5, Sources of Offer Funds
This group’s ability to provide the required 20 percent TIPRA payment was also not pres-
ent in about 70 percent of the cases.
Conclusions
Taxpayers with incomes above the poverty level are not significantly more likely to be able
to afford the 20 percent TIPRA payment than those with incomes at, or below, the poverty
level.
The most common source of offer funds is family and friends. It is unlikely that these
third parties will provide funds for an offer since they are likely to forfeit 20 percent of the
offered amount without compromising the liability for the taxpayer.
Although taxpayers in the higher income groups are more likely to have a higher value
of assets, their liquid assets are still quite limited, reinforcing the concern that even these
more affluent taxpayers will have difficulty submitting offers.
None
Other
Current Income or Wages
Property Sales
Unsecured Credit
IRA / 401k
Commercial Loan
Family / Friends
Category
0% 10% 20% 30% 40% 50% 60% 70%
10

Table of
Contents
Effect of Tax Increase and Prevention Reconciliation Act of 2005 on IRS Offer in Compromise Program
TIPRA and OIC
TIPRA and OIC
Less than half of the sample taxpayers below the poverty level are currently receiving waiv-
ers of the offer in compromise submission user fee. This fact suggests that some taxpayers
eligible for waiver of the 20 percent TIPRA payment will not be afforded this opportunity.
11
IRS offer receipts have, in fact, declined by 21 percent from FY 2006 to FY 2007.
12
Recommendations
The National Taxpayer Advocate submitted comprehensive recommendations for legisla-
tive changes affecting OICs in her recent 2006 Annual Report to Congress. These recom-
mendations are reprinted below:
Modify Internal Revenue Code § 7122(c) so that taxpayers are not required to include a
partial payment with “lump-sum” offer applications.
Alternatively, modify the OIC rules as follows:
Provide taxpayers with the right to appeal to the IRS Appeals function the IRS’s 1.
decision to return an OIC before or after accepting it for processing. The IRS could
use the existing Collection Appeals Process, which allows it to review appeals in
just five days.
Provide an exception to the partial payment requirement for taxpayers who do not 2.
have immediate access to current income and liquid assets that could be used to
fund an offer without incurring significant costs (e.g., taxable income or penal-
ties resulting from the withdrawal of assets from a qualified retirement plan). For
those taxpayers who have immediate access to such funds, the partial payment
requirement should be 20 percent (for lump-sum offers) of any current income
and liquid assets that could be disposed of immediately without significant cost.
Apply the low income exception in cases where payment of the combined OIC 3.
user fee and partial payment (or borrowing for such payments) would cause an
economic hardship.
13
11
Alternatively, some taxpayers may not obtain a waiver as a result of “procedural” or “lazy” noncompliance in which either administrative complexity is a
hurdle or taxpayers are unwilling or unable to satisfy the requirements. For more information about types of noncompliance, see Les Book, The Poor and
Tax Compliance: One Size Does Not Fit All, 51 Kan. L. Rev. 1145 (2003), citing Robert Kidder & Craig McEwen, Taxpaying Behavior in Social Context: A
Tentative Typology of Tax Compliance and Noncompliance, 2 Taxpayer Compliance 57 (1989).
12
SB/SE Collection Activity Report No. 5000-108 (Oct, 1, 2007)
13
National Taxpayer Advocate 2006 Annual Report to Congress 519.
11
Section Three — TIPRA and OIC
Appendix A – OIC Sample Results (not stratified by income)
TIPRA and OIC
Table of
Contents
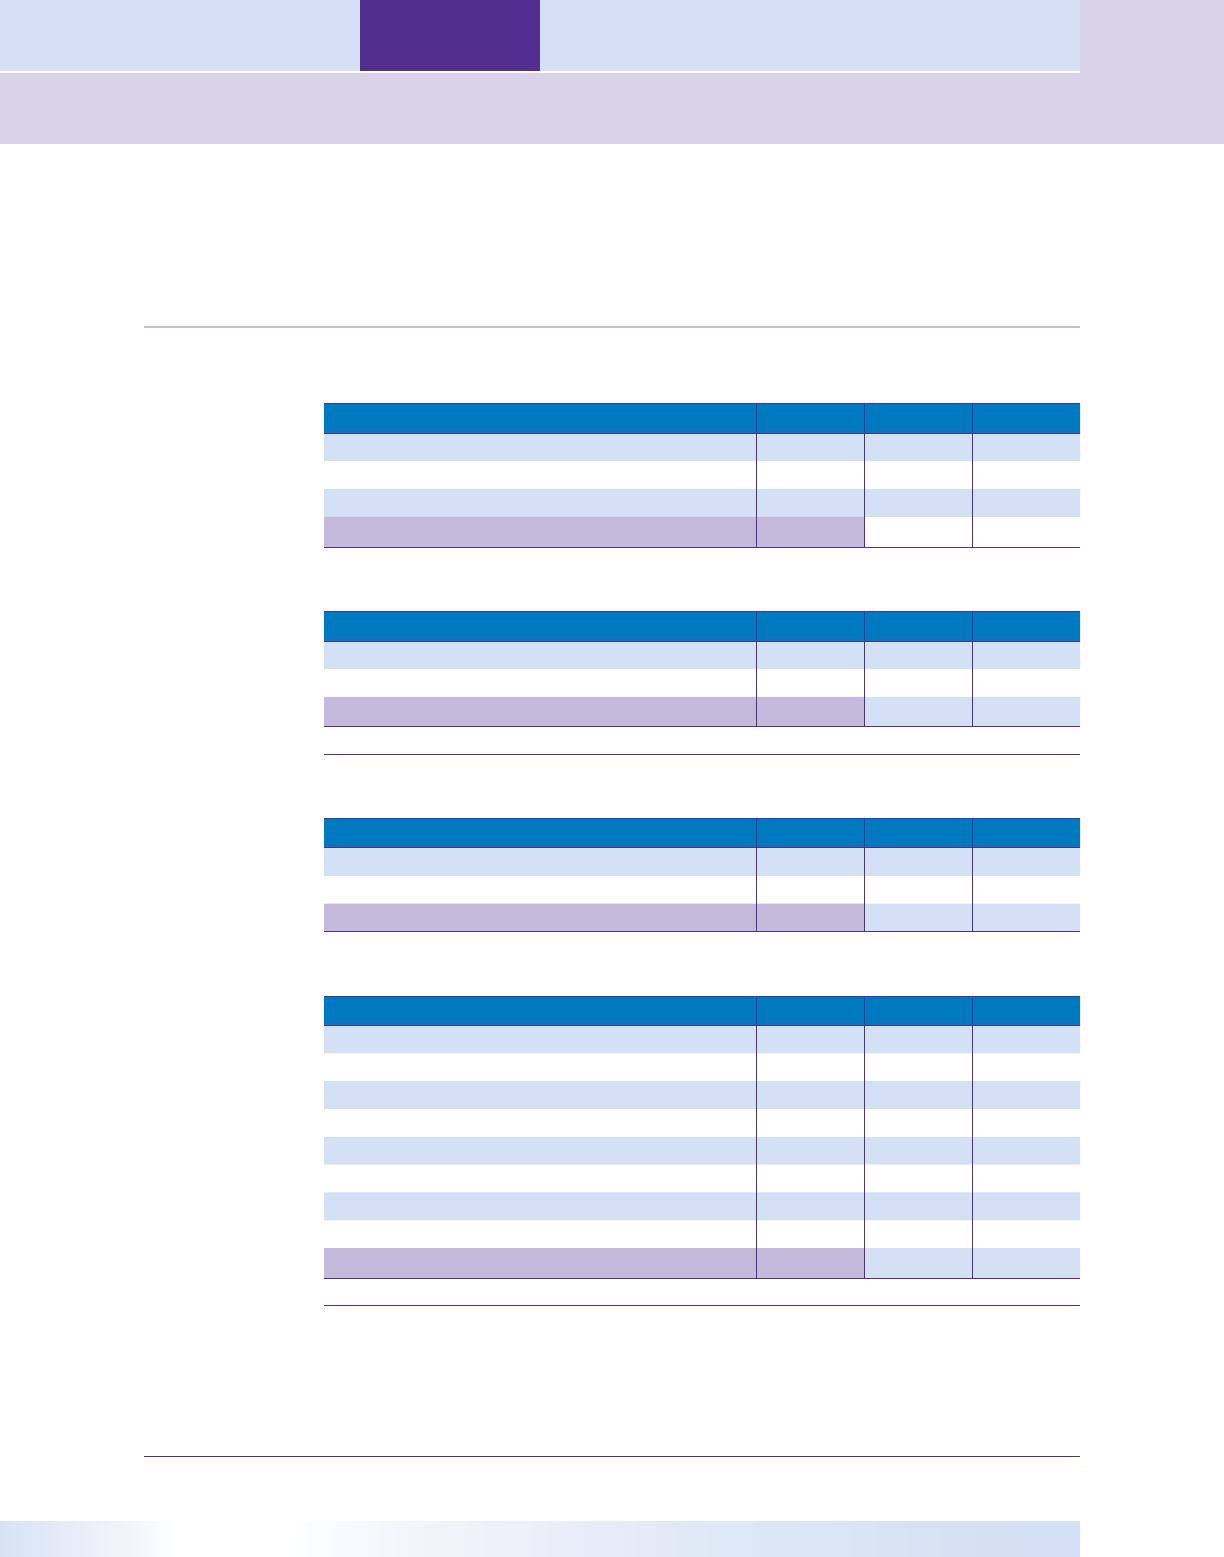
Appendix A – OIC Sample Results (not stratified by income)
14
Where was offer worked?
Category Number Percent Margin (+/-)
Field 240 58.0% 4.8%
COIC 139 33.6% 4.5%
Appeals 35 8.5% 2.7%
Total 414
Entity or individual?
Category Number Percent Margin (+/-)
Individual* 394 95.9% 1.9%
Entity 17 4.1% 1.9%
Total 411
*Includes TFRP (Trust Fund Recovery Penalty)
Type of Offer
Category Number Percent Margin (+/-)
Cash 285 71.3% 4.4%
Deferred 115 28.8% 4.4%
Total 400
Source of Funding
Category Number Percent Margin (+/-)
Family / Friends 232 56.0% 4.8%
Commercial Loan 24 5.8% 2.3%
IRA / 401K 9 2.2% 1.4%
Unsecured Credit 5 1.2% 1.1%
Property Sale 10 2.4% 1.5%
Current Income or Wages 123 29.7% 4.4%
Other 7 1.7% 1.2%
None 18 4.3% 2.0%
Total* 414
*Total Sample Cases. Question allowed multiple responses.
14
Totals may not add up to 100 percent due to rounding.
12
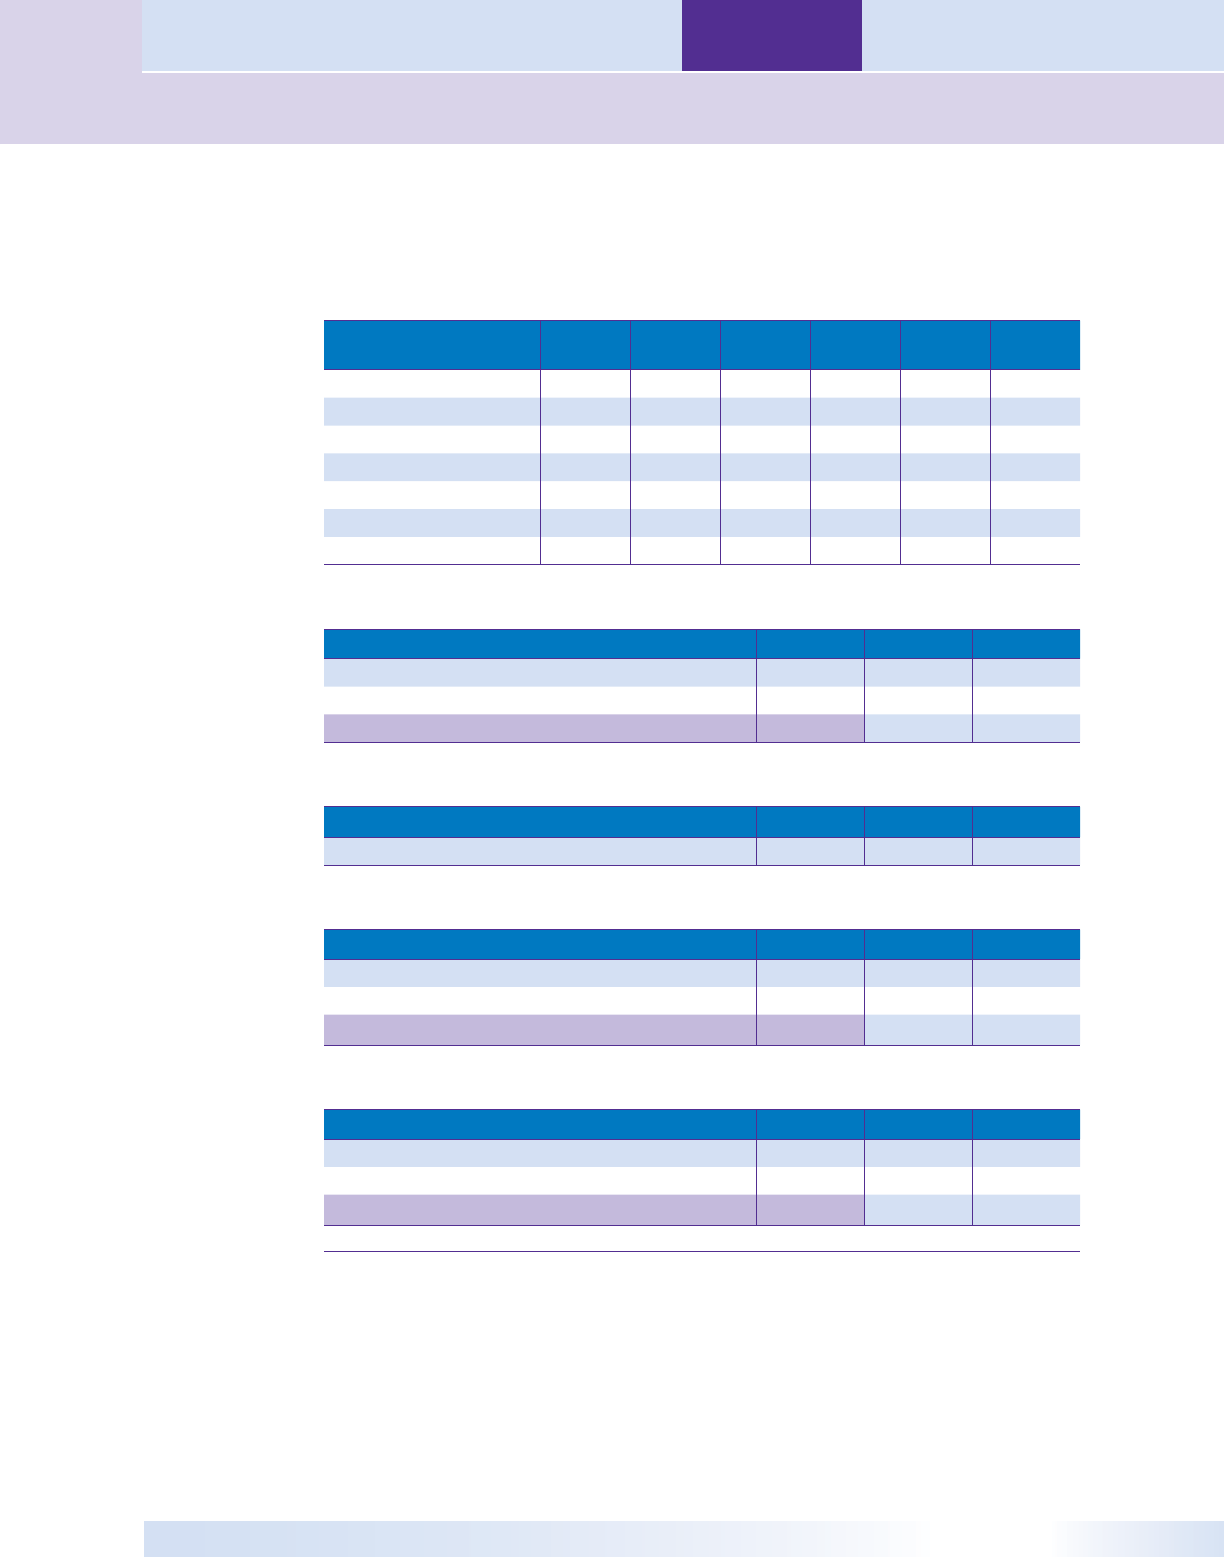
Table of
Contents
Appendix A – OIC Sample Results (not stratified by income)
TIPRA and OIC
TIPRA and OIC
Sample Characteristics
Mean Lower Limit Upper Limit
Median Lower
Limit
Median
Median Upper
Limit
Initial Amount Offered $ 8,796 $ 6,932 $ 10,660 $ 2,500 $3,000 $ 3,600
Gross Monthly Income (IET) $ 6,129 $ 62 $ 12,197 $ 2,287 $2,552 $ 2,750
Net Monthly Income (IET) $ 1,651 $ 1,445 $ 1,858 $ 257 $ 652 $ 1,199
Total Future Income (IET or AET) $ 8,006 $ 6,243 $ 9,769 $ - $ - $ -
Net Assets (AET) $ 13,912 $ 10,479 $ 17,345 $ 2,009 $ 2,531 $ 3,523
Liquid Assets $ 965 $ 593 $ 1,338 $ 90 $ 107 $ 161
Accepted OIC Amount $16,171 $ 13,392 $ 18,951 $ 5,000 $5,233 $ 6,297
Fee Waiver?
Category Number Percent Margin (+/-)
Yes 42 10.3% 3.0%
No 364 89.7% 3.0%
Total 406
Number of Family Members
Mean Lower Limit Upper Limit
Family Members 2 2 3
Hardship, ETA, or Special Circumstances?
Category Number Percent Margin (+/-)
Yes 21 5.1% 2.1%
No 392 94.9% 2.1%
Total 413
TIPRA 20 Percent Payment Available?
Category Number Percent Margin (+/-)
Yes 116 28.1% 4.3%
No 297 71.9% 4.3%
Total 413
All margins and confidence intervals are expressed at the 95 percent level.
13
Section Three — TIPRA and OIC
Appendix B – OIC Sample Results (stratified by income)
TIPRA and OIC
Table of
Contents
Appendix B – OIC Sample Results (stratified by income)
15
Where was offer worked?
At or Below Poverty Level
Above Poverty Level and At or Below
250% of Poverty Level
Above 250% of Poverty Level
Category Number Percent
Margin
(+/-)
Number Percent
Margin
(+/-)
Number Percent
Margin
(+/-)
Field 30 62.5% 13.7% 82 52.2% 7.8% 118 60.5% 6.9%
COIC 15 31.3% 13.1% 64 40.8% 7.7% 57 29.2% 6.4%
Appeals 3 6.3% 6.8% 11 7.0% 4.0% 20 10.3% 4.3%
Total 48 157 195
Entity or Individual?
At or Below Poverty Level
Above Poverty Level and At or Below
250% of Poverty Level
Above 250% of Poverty Level
Category Number Percent
Margin
(+/-)
Number Percent
Margin
(+/-)
Number Percent
Margin
(+/-)
Individual* 45 93.8% 6.8% 152 96.8% 2.7% 187 96.9% 2.4%
Entity 3 6.3% 6.8% 5 3.2% 2.7% 6 3.1% 2.4%
Total 48 157 193
*Includes TFRP
Type of Offer
At or Below Poverty Level
Above Poverty Level and At or Below
250% of Poverty Level
Above 250% of Poverty Level
Category Number Percent
Margin
(+/-)
Number Percent
Margin
(+/-)
Number Percent
Margin
(+/-)
Cash 40 83.3% 10.5% 116 74.4% 6.9% 120 62.5% 6.8%
Deferred 8 16.7% 10.5% 40 25.6% 6.9% 72 37.5% 6.8%
Total 48 156 192
15
Appendix B total case counts across all three strata are less than Appendix A total case counts because income information was not available to compute
the strata for 14 cases. Totals may not add up to 100 percent due to rounding.
14
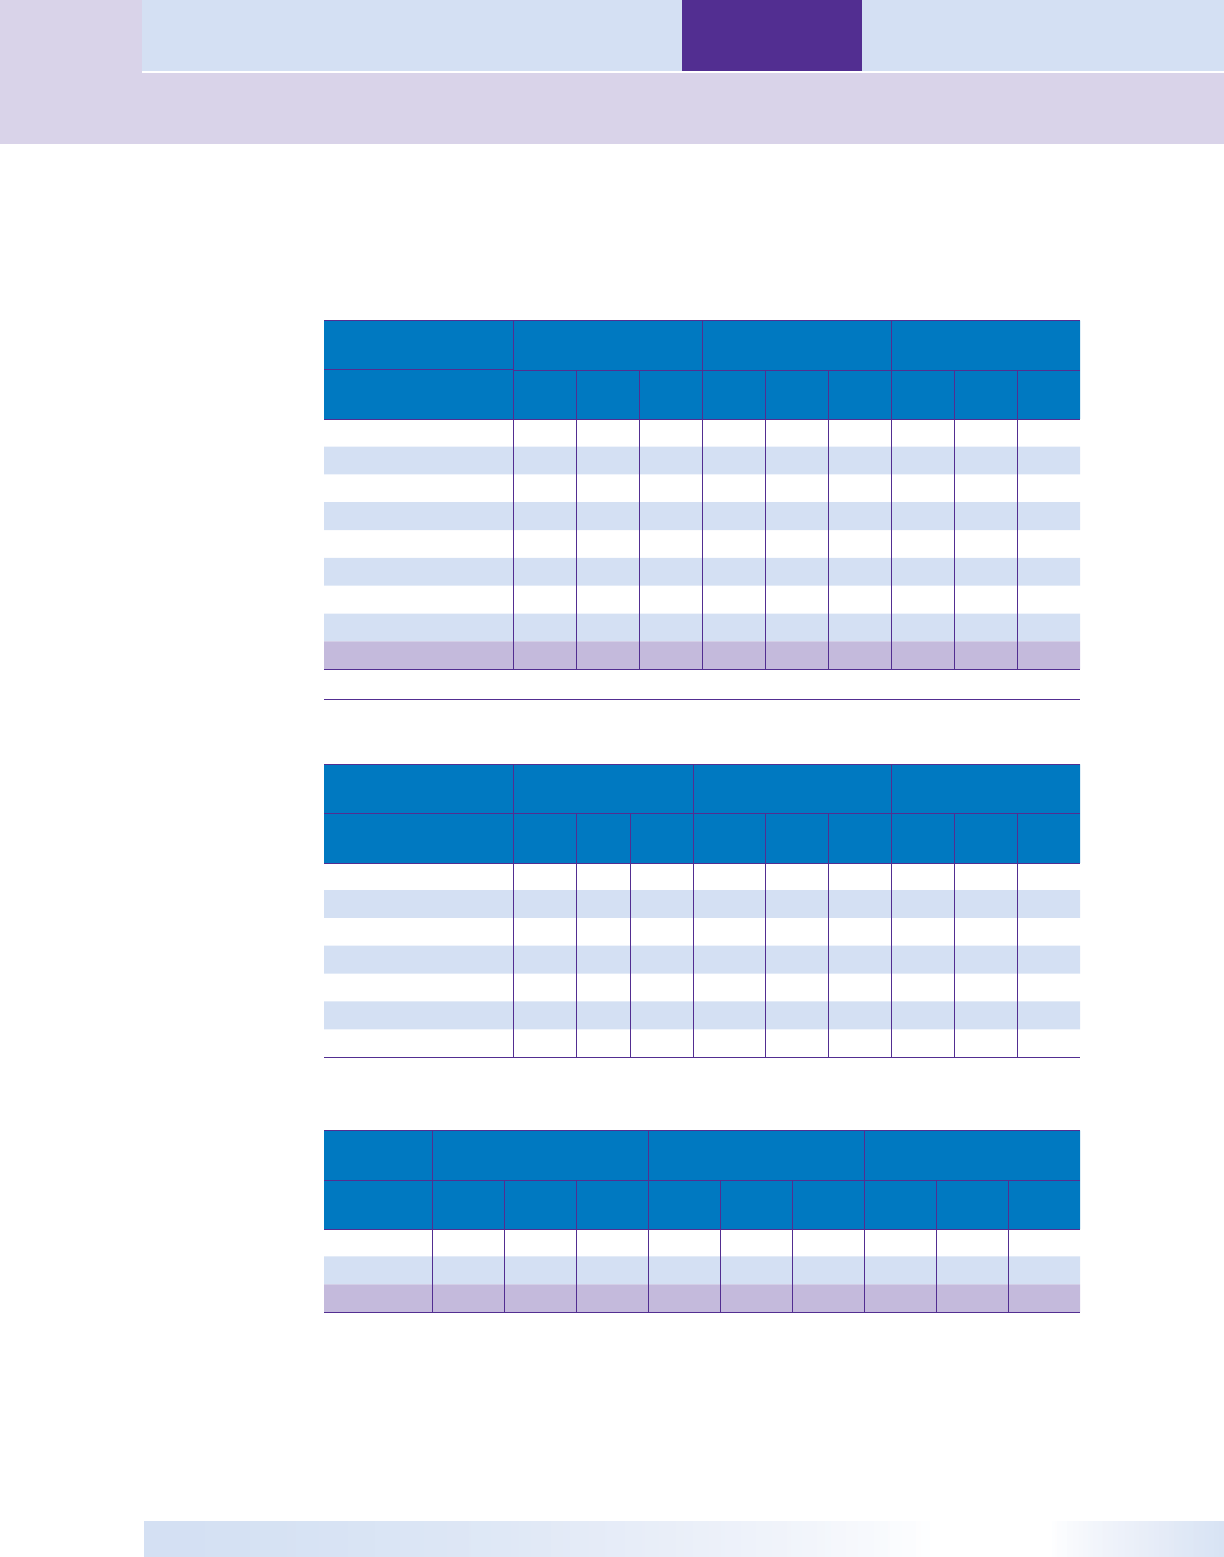
Table of
Contents
Appendix B – OIC Sample Results (stratified by income)
TIPRA and OIC
TIPRA and OIC
Source of Funding
At or Below Poverty Level
Above Poverty Level and At or
Below 250% of Poverty Level
Above 250% of Poverty Level
Category Number Percent
Margin
(+/-)
Number Percent
Margin
(+/-)
Number Percent
Margin
(+/-)
Family/Friends 28 58.3% 13.9% 98 62.4% 7.6% 98 50.3% 7.0%
Commercial Loan 3 6.3% 6.8% 6 3.8% 3.0% 15 7.7% 3.7%
IRA/401K 1 2.1% 4.0% 3 1.9% 2.1% 5 2.6% 2.2%
Unsecured Credit 1 2.1% 4.0% 1 0.6% 1.2% 3 1.5% 1.7%
Property Sale 2 4.2% 5.7% 3 1.9% 2.1% 4 2.1% 2.0%
Current Income or Wages 11 22.9% 11.9% 43 27.4% 7.0% 66 33.8% 6.6%
Other 2 4.2% 5.7% 2 1.3% 1.8% - 0.0% 0.0%
None 0 0.0% 0.0% 9 5.7% 3.6% 9 4.6% 2.9%
Total* 48 157 195
*Total Sample Cases. Question allowed multiple responses.
Sample Characteristics
At or Below Poverty Level
Above Poverty Level and At or
Below 250% of Poverty Level
Above 250% of Poverty Level
Mean
Lower
Limit
Upper
Limit
Mean
Lower
Limit
Upper
Limit
Mean
Lower
Limit
Upper
Limit
Initial Amount Offered $ 9,284 $ 422 $ 18,147 $ 4,155 $3,190 $ 5,120 $ 12,521 $ 9,456 $ 15,590
Gross Monthly Income (IET) $ 542 $ 390 $ 693 $ 1,996 $ 1,865 $ 2,126 $ 10,877 $(1,798) $ 23,553
Net Monthly Income (IET) $ 502 $ 260 $ 745 $ 1,035 $ 830 $ 1,239 $ 2,490 $ 2,132 $ 2,848
Total Future Income (IET or AET) $ 262 $ (51) $ 576 $ 1,899 $ 1,001 $ 2,798 $ 14,849 $ 11,535 $ 18,163
Net Assets (AET) $ 20,096 $ 5,212 $ 34,981 $ 5,647 $ 3,851 $ 7,443 $ 19,336 $ 13,453 $ 25,219
Liquid Assets $ 213 $ 123 $ 303 $ 471 $ 332 $ 610 $ 1,322 $ 703 $ 1,942
Accepted OIC Amount $ 12,814 $ 2,413 $ 23,216 $ 6,860 $ 5,275 $ 8,446 $ 24,631 $ 19,790 $ 29,472
Fee Waiver?
At or Below Poverty Level
Above Poverty Level and At or Below
250% of Poverty Level
Above 250% of Poverty Level
Category Number Percent
Margin
(+/-)
Number Percent
Margin
(+/-)
Number Percent
Margin
(+/-)
Yes 17 35.4% 13.5% 17 10.8% 4.9% 7 3.7% 2.6%
No 31 64.6% 13.5% 140 89.2% 4.9% 184 96.3% 2.6%
Total 48 157 191
15
Section Three — TIPRA and OIC
Appendix B – OIC Sample Results (stratified by income)
TIPRA and OIC
Table of
Contents
Number of Family Members
At or Below Poverty Level
Above Poverty Level and At or Below
250% of Poverty Level
Above 250% of Poverty Level
Mean
Lower
Limit
Upper
Limit
Mean
Lower
Limit
Upper
Limit
Mean
Lower
Limit
Upper
Limit
Family Members 2 2 2 2 2 2 2 2 2
Hardship, ETA, or Special Circumstances?
At or Below Poverty Level
Above Poverty Level and At or Below
250% of Poverty Level
Above 250% of Poverty Level
Category Number Percent
Margin
(+/-)
Number Percent
Margin
(+/-)
Number Percent
Margin
(+/-)
Yes 2 4.2% 5.7% 7 4.5% 3.2% 12 6.2% 3.4%
No 46 95.8% 5.7% 150 95.5% 3.2% 183 93.8% 3.4%
Total 48 157 195
TIPRA 20 Percent Payment Available?
At or Below Poverty Level
Above Poverty Level and At or Below
250% of Poverty Level
Above 250% of Poverty Level
Category Number Percent
Margin
(+/-)
Number Percent
Margin
(+/-)
Number Percent
Margin
(+/-)
Yes 10 20.8% 11.5% 46 29.3% 7.1% 56 28.7% 6.4%
No 38 79.2% 11.5% 111 70.7% 7.1% 139 71.3% 6.4%
Total 48 157 195
All margins and confidence intervals are expressed at the 95 percent level.
16
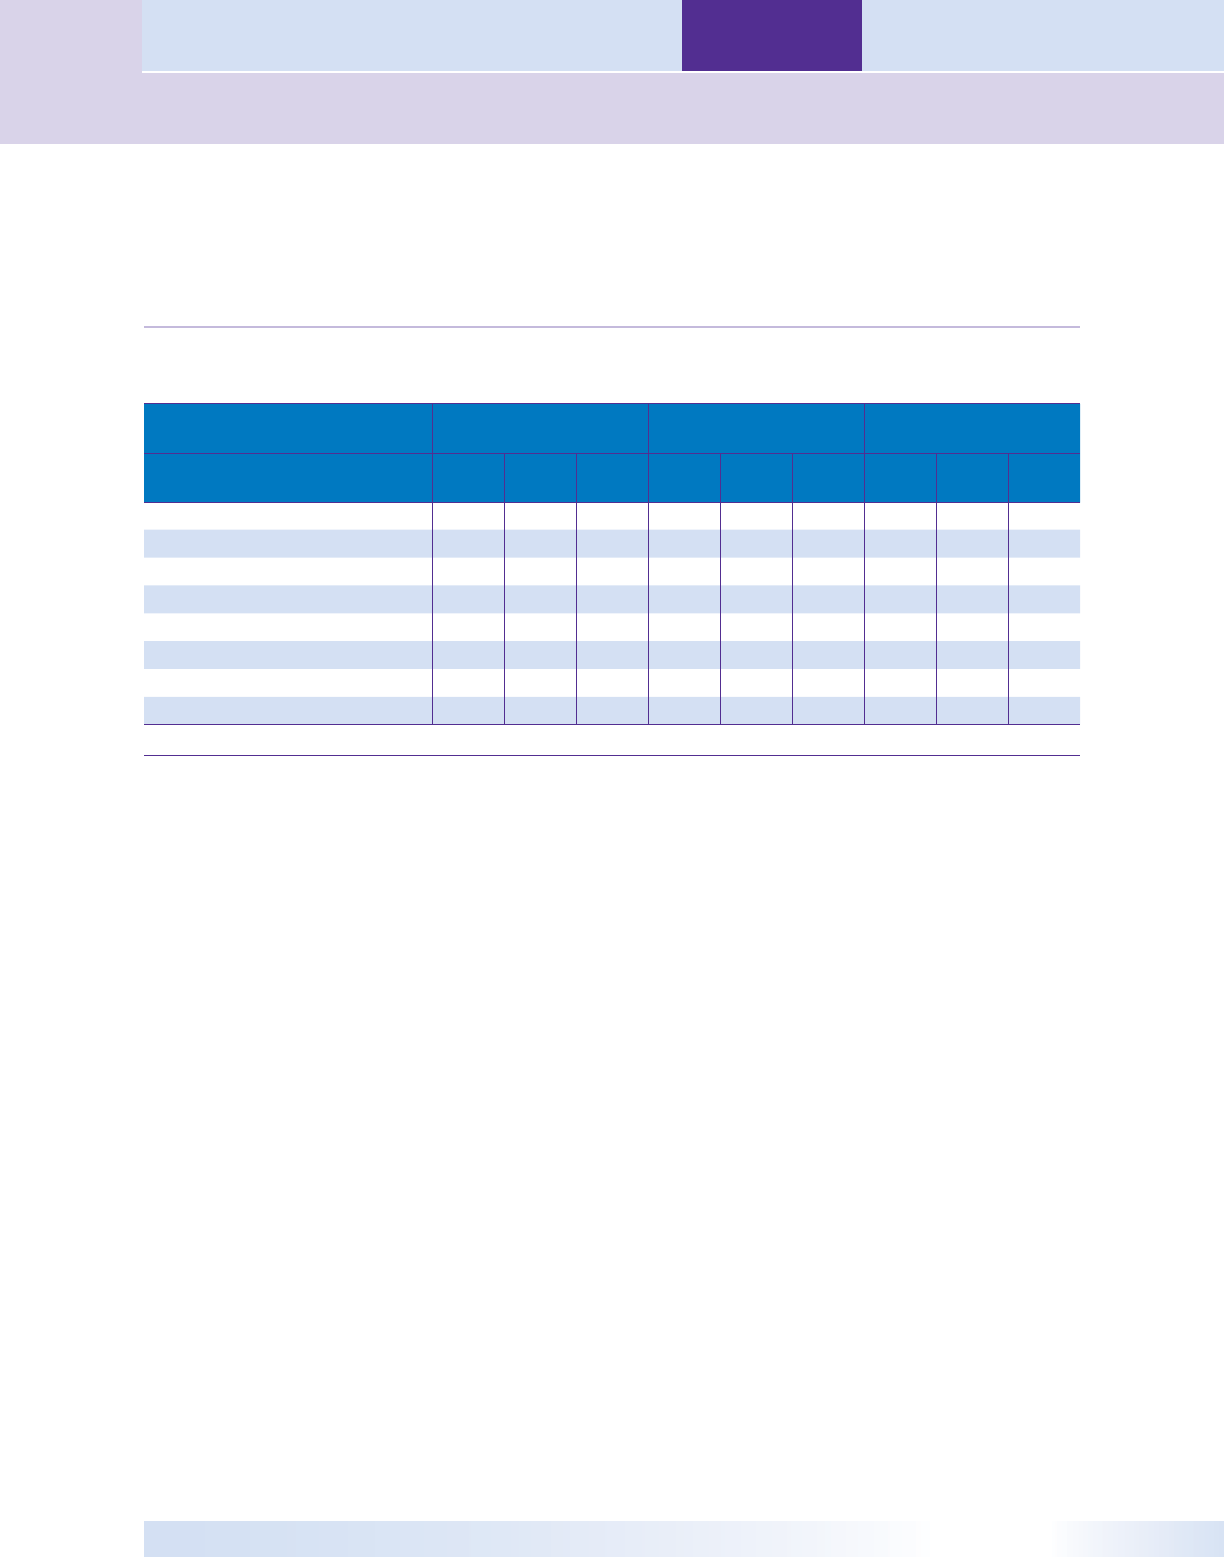
Table of
Contents
Appendix C – Confidence Intervals for Medians
TIPRA and OIC
TIPRA and OIC
Appendix C – Confidence Intervals for Medians
Sample Characteristics
At or Below Poverty Level
Above Poverty Level and At or Below
250% of Poverty Level
Above 250% of Poverty Level
Median
Lower
Limit
Upper
Limit
Median
Lower
Limit
Upper
Limit
Median
Lower
Limit
Upper
Limit
Initial Amount Offered $1,000 $ 500 $ 2,400 $2,571 $ 1,950 $ 3,039 $ 4,900 $ 3,106 $ 5,000
Gross Monthly Income (IET) $ 519 $ 203 $ 584 $1,850 $ 1,705 $ 2,000 $ 3,626 $ 3,389 $ 3,832
Net Monthly Income (IET) $ - $ - $ 23 $ 73 $ - $ 1,041 $ 2,269 $ 1,294 $ 2,876
Total Future Income (IET or AET) $ - $ - $ - $ - $ - $ - $ 3,264 $ - $ 6,864
Net Assets (AET) $1,012 $ 240 $ 2,400 $1,917 $ 1,374 $ 2,987 $ 4,263 $ 2,531 $ 6,533
Liquid Assets $ 58 $ - $ 149 $ 100 $ 50 $ 195 $ 148 $ 98 $ 222
Accepted OIC Amount $2,000 $ 548 $ 2,746 $3,732 $ 3,000 $ 4,700 $10,601 $ 7,898 $14,356
Family Members 1 1 2 1 1 2 2 1 2
All confidence intervals are expressed at the 95 percent level.
17
